
Hidden engineering inside plastic recycling machines decides how stable the machine runs and how much it earns over time. Engineering choices inside plastic recycling machines directly affect load handling, wear, output, and profitability.
In polymer recycling, temperature is not a setting — it is a gradient. A single degree deviation across zones can shift viscosity enough to alter shear stress, residence time, and molecular scission. What looks like a harmless ±1°C fluctuation at the panel becomes inconsistent melt behavior at the die.
Engineers track temperature because it governs chain mobility. Operators often chase output. Profitable lines respect the physics.
📊 Melt viscosity vs temperature curve showing exponential sensitivity around processing window. [see graph below]
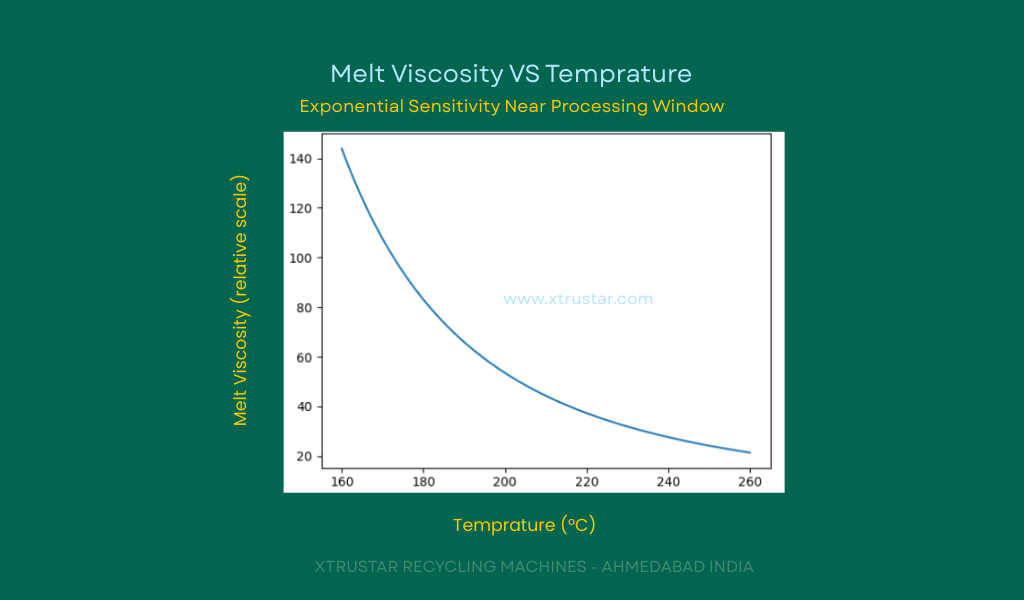
The graph above shows: A single degree deviation can shift viscosity enough to alter shear stress, residence time, and molecular scission and why 1°C matters in Plastics Recycling and Plastics Extrusion.
Screw wear does not announce itself. There is no alarm when flight clearance increases by fractions of a millimeter. Yet every micron lost reduces pumping efficiency, increases backflow, and raises energy per kilogram.
The tragedy is timing: by the time output visibly drops, the profit erosion has already been happening for months. Good engineering measures wear rate, not just end-of-life failure.
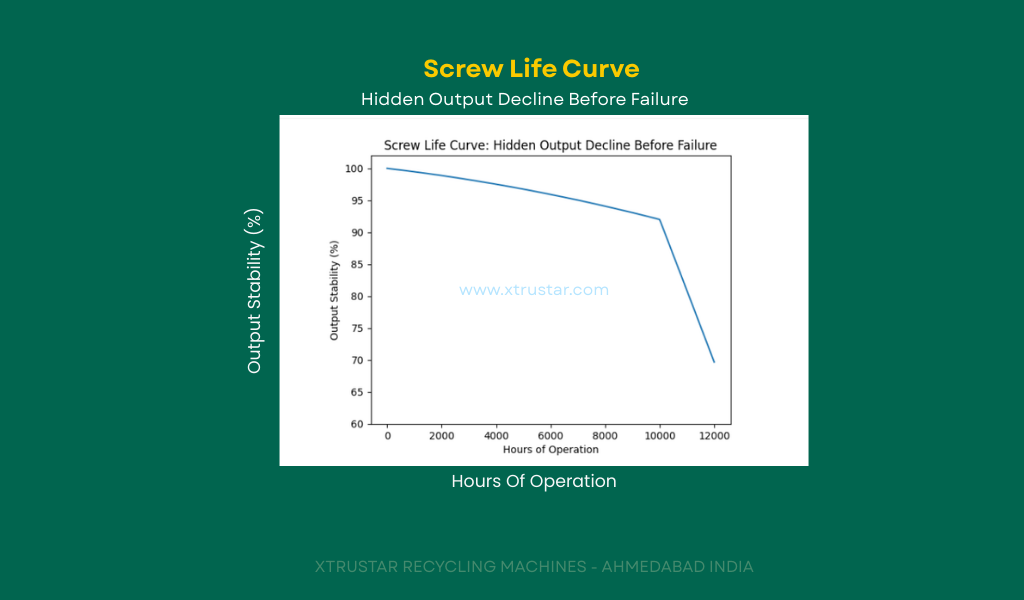
📉 Screw life curve — output stability vs hours of operation, showing hidden decline before failure. [see graph below]
The chart above shows:
Screw Life Curve: Hidden Output Decline Before Failure
X-axis: Hours of Operation
Y-axis: Output Stability (%)
Engineering meaning:
0–7,000 hrs:
Output looks “stable” → operators feel everything is fine
7,000–10,000 hrs:
Silent loss due to:
flight wear
increased backflow
reduced pumping efficiency
After ~10,000 hrs:
Rapid collapse → visible failure → unplanned downtime
By the time failure is visible, profit erosion is already over.
Melt pressure is often treated as a mechanical limit. In reality, it is a material signal. Stable pressure indicates uniform melting, controlled shear, and predictable residence time.
Pressure oscillations translate directly into dimensional variation, gels, and surface defects. Engineers read pressure the way doctors read vital signs.
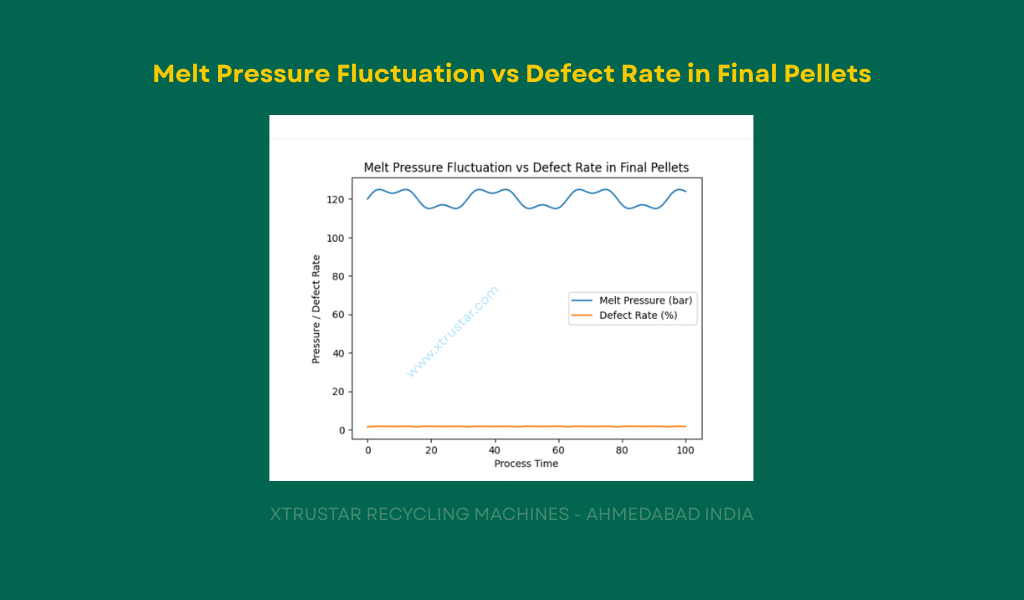
📈 Pressure fluctuation graph mapped against defect rate in final pellets. [see graph below]
Above photo containing graph showing:
X-axis:
Process Time (continuous operation)
Y-axis:
Melt Pressure (bar)
Defect Rate (%)
Two signals plotted together to show correlation, not coincidence.
Engineering meaning:
The blue curve shows melt pressure oscillations caused by:
uneven melting
screw wear
inconsistent feed or temperature
The defect rate curve rises and falls in sync with pressure instability
Pressure instability directly translates into pellet defects — gels, voids, poor surface finish.
Engineers read pressure the way doctors read vital signs.
Fluctuations in melt pressure indicate unstable melting and flow behavior.
These instabilities manifest directly as defects in the final pellets,
long before catastrophic process failure occurs.
Throughput looks impressive. Output per hour makes dashboards happy. But energy per kilogram reveals the truth.
High energy consumption per kg signals poor melting efficiency, worn components, or incorrect process windows. Profitable recycling lines optimize physics first — accounting follows naturally.
⚡ Energy Consumption per kg — Before and After Process Optimization.
Energy efficiency is the real KPI in recycling operations [see graph below]
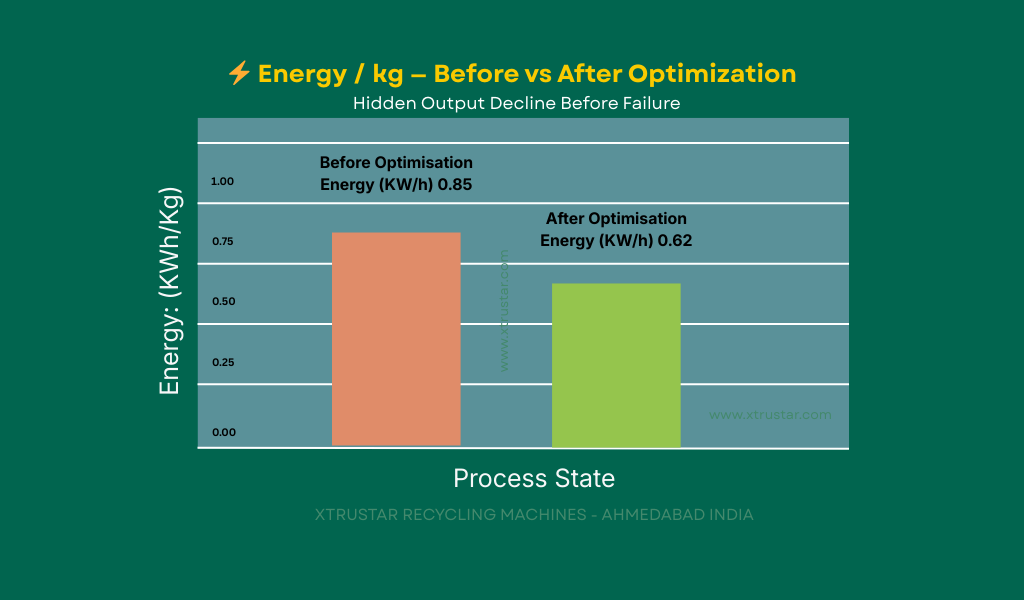
In above Photo: Representative data for a standard single-screw plastic recycling extruder.
Values illustrate relative energy reduction achieved through process
optimization (temperature profile, screw condition, and pressure stability),
not a specific machine model.
A generic single-screw extruder in a plastic recycling line, typically:
PP / PE recycling
Throughput: 300–800 kg/hr
Motors: 75–160 kW
Standard filtration (screen changer / melt filter)
Profit in recycling is not luck, not price, not brand — it is the result of controlled physics.
What This Means for a Recycler ?
Most recyclers don’t buy machines thinking about viscosity curves, pressure stability, or screw wear rates.
They buy machines thinking about price, output, and delivery time.
That is understandable.
But what actually decides profit is what happens after the machine starts running.
A machine that looks cheap on day one can quietly become expensive:
when electricity consumption creeps up, output drops without warning, material quality becomes inconsistent, when screws wear faster than expected.
These problems don’t come from bad luck. They come from uncontrolled engineering.
The graphs on this page are not academic. They explain why some machines run smoothly for years — and why others struggle after a few months.
At Xtrustar, we don’t believe that machines make money — engineering does. Real profit in recycling does not come from a machine that merely runs, but from one that runs the same way every day, without silently increasing power consumption, degrading output quality, or wearing itself out faster than expected. Stable temperature behavior, controlled screw wear, calm and predictable melt pressure, and consistent energy per kilogram are not academic ideas — they are what decide whether a recycler earns steadily or keeps firefighting problems. Recyclers don’t need to understand polymer science or read graphs; that is not their job. Their job is to run the business. Our job is to ensure the machine never works against it. When output stays stable, quality remains consistent, and power consumption does not creep up, profit becomes predictable.
You don’t need to understand these graphs — you need a machine built by someone who does.
If you’re running or planning a recycling unit, speak with Xtrustar.
Share your material and capacity — we’ll help you choose a machine that works for your business, not against it.
Call us at: Mobile: 9227004488
Engineers bookmark this page.
You are on page 21 of this website.
© Xtrustar Machines Pvt. Ltd., Ahmedabad, India. All rights reserved. This website content is protected under applicable intellectual property laws. Any unauthorized copying or misuse of technical content may result in legal action under intellectual property regulations.